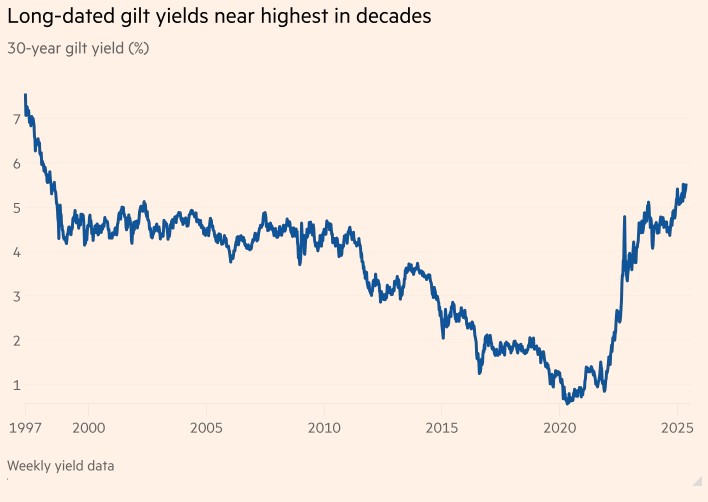
The Financial Times on 27th May carried an article entitled “UK turns to shorter-term borrowing as fiscal pressure mounts”, and sub headed “Head of Debt Management Office [DMO] says demand for long-term gilts is waning”. It notes that long term gilts yields are at their highest level “in decades” and that the DMO is planning to reduce issuance of long-term gilts. We thought it might be useful to look at the attraction of these long gilts for private investors, and to provide an explanation of the yield curve.
The yield on 30-year UK gilts is currently trading well above 5% (5.45% as of 28th May), a level not sustained since the late 1990s.
This represents a significant re-rating of long-term risk-free rates, which has been driven by:
Long-duration gilts now offer attractive nominal returns. For liability-driven investors such as pension funds or family offices managing intergenerational wealth, the income can be seen as both secure and attractive, relative to recent decades – at least if sterling is seen as an acceptable base currency. Private investors may also be attracted to the current yields to park cash for the long-term, in the knowledge that there is very good liquidity in these bonds should they need to sell before maturity.
The yield curve is a graphical representation of interest rates (or yields) on government bonds of different maturities at a single point in time. In the UK, it is typically drawn using gilts — government bonds ranging from short-term (e.g. one year) to long-term (e.g. 30 years). Here is the current UK gilts yield curve (the blue line), showing the change in shape since a year ago:

A normal curve is when long-term bonds have higher yields than short-term ones. This is typical in a healthy, growing economy. Investors demand a higher return for tying up money for longer periods.
A flat curve happens when yields are similar across all maturities. This may be a signal that markets are unsure whether growth or recession is ahead.
An inverted yield curve happens when long-term yields are lower than short-term ones. This is fairly unusual and often seen as a recession warning. Investors expect rates to fall in the future due to slowing growth or falling inflation.
The current gilt curve is particularly steep out to a peak at 30 years. This implies the market is pricing in persistent inflation risk and uncertainty around the pace of rate cuts. Investors are demanding compensation for duration risk, fiscal uncertainty and supply overhang.
The Bank of England’s Quantitative Tightening that started on 1st November 2022 has not helped. The Bank actively reversed its previous Quantitative Easing operations by not only ceasing reinvestment of maturing gilts but also initiating active gilt sales. In addition, there has been reduced demand for duration among liability-driven investors (predominantly managers of defined contribution pension funds) post the “LDI crisis”, which followed the mini budget in 2022, and because defined contribution funds themselves have become a smaller part of the market.
For long-term investors this may represent an opportunity to lock in relatively attractive rates not seen since the late 1990s.
The 30-year gilt breakeven inflation rate, calculated as the difference between nominal and index-linked gilt yields of equivalent maturity, currently sits at approximately 3.5%. This implies:
If one believes that long-term UK inflation will revert to the Bank of England’s 2% target, then conventional gilts at these levels appear highly attractive in real terms. Conversely, if inflation proves more stubbornly embedded above 3%, inflation-linked gilts (or real assets) become the superior hedge.
Some of the long-duration gilts were issued when rates were much lower and, correspondingly, are now trading at substantial discounts to their eventual redemption price. For example, the 1.625% 2054 gilt is trading at 45.122. Under current QCB rules, the accretion over time to 100, over a third of the return, would be free of capital gains tax.
Private investors with long time horizons may well want to consider 30-year gilts at current yields to form part of their portfolios. These bonds offer:
Risks include resurgent inflation, continued UK fiscal deterioration, and a structurally higher global rate regime. As such, investors might want to consider a blend of standard and inflation-linked gilts, as well as some corporate bonds and MTN issues to enhance the yield of the portfolio overall. At LGB, we continue to favour a buy-and-hold laddered fixed income portfolio, investing in fixed income instruments with staggered maturities to benefit from regular liquidity and a defined overall return.

Transaction Manager
Alexia Rottet joined LGB in October 2025 as a Transaction Manager. Prior to LGB, she gained real estate experience by participating in the valuation of a property portfolio for A2immo.ch SA as a financial analyst, as well as working at Form Structural Design as an office manager. Alexia holds an MA in Entrepreneurship and Innovation and a BA in International Relations.

Assistant Relationship Manager
Ruby joined LGB in December 2024 as an Assistant Relationship Manager for our investing clients. Prior to LGB, Ruby worked at FHIRST, a start-up where she collaborated with the co-founders on revenue growth and improving client experiences. Ruby graduated with a First-Class degree in History from Durham University.

Finance Manager
Following a degree reading Chemistry at The Queen’s College, Oxford, Antonia trained to become a chartered accountant at a London-based audit firm. She then moved into the tax sector joining EY and completing the chartered tax adviser qualification. She then gained further experience working as a finance director within industry at a family office / hedge fund.
Programme size: £20m
Establishment Date: December 2017
Number of issues: 12
Sector: Marine tracking
Focus: Maritime surveillance and management
Programme size: £25m
Establishment Date: XX 2017
Number of issues: 20
Sector: Financial services
Focus: Loans and leasing

Associate Director
Omar joined LGB in February 2026 as an Associate Director in the Capital Markets team. He brings over five years of experience from NatWest, where he worked across the Leveraged Finance Origination and Portfolio Management teams. During this time, he supported a broad range of businesses from venture-backed to large-cap companies, with a primary focus on the mid-market. His experience was sector agnostic, and the majority of the companies he worked with were sponsor-backed, giving him extensive exposure to private equity-led transactions and capital structures. Omar holds a degree in Accounting and Finance from The London School of Economics & Political Science and is a Chartered Banker.

Adviser
Charles has played an important role in developing LGB & Co.’s investment approach by encouraging a focus on investing in businesses with strong IP or know-how with recurring revenue business models that can prosper throughout economic cycles. Charles brings over 30 years’ experience of investing in privately-owned and publicly-listed small and mid-market companies. He is a director of Larpent Newton & Co. and Hygea VCT plc. Charles qualified as a Chartered Accountant at Peat Marwick, now part of KPMG.

Adviser
Lisa has worked with LGB since 2015 in supporting the on-going cultural and organisational development of the firm, providing advice on strategic people matters. Since 2006, Lisa has been running her own consultancy and executive coaching business, People Possibilities Ltd. Her work is focused on supporting clients at an organisational, team and individual level to enable high performance,improve leadership capability and effect cultural and behavioural change. Previously Lisa has held senior HR leadership positions with Schroders, ABN AMRO and HSBC. Lisa graduated from the University of Birmingham with an honours degree in International Relations & French. She is a Fellow of the Chartered Institute of Personnel and Development (CIPD) and a qualified Executive Coach.

Chairman
Simon became non-executive Chairman of the Board of LGB & Co. with a focus on growth and strategic initiatives in December 2025. Simon has extensive experience in capital markets and wealth management. He previously ran the client and investment business of Heartwood and became Chief Executive in 2008. He led its well-regarded acquisition by Handelsbanken in 2013. Simon subsequently became NED and Chair of AIM-listed WH Ireland Group PLC. He was also asked to represent the wealth management sector on the FCA Smaller Business Practitioner Panel from 2013-2016.

Capital Markets Director
Fergus advises corporate clients looking to raise debt and equity capital. He is also responsible for the execution and ongoing management of LGB’s MTN Programmes. Fergus joined LGB in 2019 having started his career at Lloyds Banking Group on the graduate training programme, before moving to the Leveraged Finance division, where he focused on transactions with mid-market corporates and PE firms. Fergus holds an MSc in Petroleum Geology from the University of Aberdeen.

Associate Director
Megan joined LGB in 2021 as a Relationship Manager. She is responsible for all day-to-day transactions with investment clients and oversees the LGB Investments Platform and Deal Hub. Prior to LGB, Megan worked at Puma Investments, a tax-efficient investment provider, in the sales and investor services team. Megan graduated from the University of Bath with a Bachelor of Science degree in Psychology, and has obtained the CISI Level 4 Diploma in Investment Advice.

Investment Director
Ivan is LGB’s Investment Director: he is responsible for developing LGB’s investment proposition in the context of the broader market and economic developments. He regularly meets individual company management teams to seek out and monitor investment opportunities. Ivan has served as a senior adviser to the Equity Division of Société Générale, and was previously Managing Director in charge of equity sales for them in London. Earlier in his career, Ivan worked at Morgan Stanley, Lazards and Schroders. He has degrees in history from Cambridge University & London University, and an MBA from Cass Business School.

Managing Director
Simone joined LGB in 2012 and is responsible for LGB & Co.’s business with institutional investors, wealth managers and sophisticated private investors. Simone’s team provides access to a range of compelling investment opportunities with a particular emphasis on structuring laddered portfolios of fixed income. In addition, the team manages portfolios of clients who have entered into advisory agreements with LGB Investments, and advises the fund managers of the Guernsey-based LGB SME Private Debt Fund. Prior to joining LGB & Co., Simone worked in the institutional fixed income department of Citigroup Global Markets. She began her career at Citigroup Private Bank in Geneva. Simone graduated from the University of Lausanne with a degree in HEC, Business Administration. She is a Chartered Member of the Chartered Institute for Securities & Investments and a Director of LGB.

CEO
Cedric was appointed CEO in July 2022 after a period of 18 months as a COO. Cedric spent 15 years working on the energy and commodities sales and trading desks for global banks (BNP Paribas, BAML and MUFG). He gained extensive international exposure, being based in London and Singapore and covering transactions in all geographic regions. Cedric graduated from Global Executive MBA at INSEAD in 2018 and started working in the capital markets space for growth-stage companies. He is also a director of LGB.

Managing Director, Capital Markets
Andrew founded LGB & Co. in 2005 and is managing the Capital Markets team. He has a particular focus on the development of strategic relationships with corporate clients and business partners. Prior to founding LGB & Co., Andrew was a Managing Director at Citigroup Global Markets, where he was responsible for its fixed-income business with private banks and retail institutions. Earlier in his career Andrew worked at Schroders in London and Tokyo. Andrew graduated from Oxford University with a degree in Modern History. He is a chartered member of the Chartered Institute for Securities & Investment.